
Microwave assisted synthesis of bismuth titanate nanosheets and its photocatalytic effects
- Published
- Accepted
- Received
- Academic Editor
- Junkuo Gao
- Subject Areas
- Electronic, Optical and Magnetic, Nano and Microstructured Materials
- Keywords
- Microwave synthesis, Bismuth titanate, Photocatalysis, Band gap
- Copyright
- © 2023 Correya et al.
- Licence
- This is an open access article distributed under the terms of the Creative Commons Attribution License, which permits unrestricted use, distribution, reproduction and adaptation in any medium and for any purpose provided that it is properly attributed. For attribution, the original author(s), title, publication source (PeerJ Materials Science) and either DOI or URL of the article must be cited.
- Cite this article
- 2023. Microwave assisted synthesis of bismuth titanate nanosheets and its photocatalytic effects. PeerJ Materials Science 5:e26 https://doi.org/10.7717/peerj-matsci.26
Abstract
Bismuth titanate syntheses using wet chemical methods are comparatively time-consuming and require long durations for completion using the well-studied sol-gel method. In this work, we use microwave initiated combustion method to produce ultra-thin bismuth titanate nanosheets. This method reduces the time required for the synthesis down to minutes, when compared to hours or days in most other methods. The thickness of the synthesized sheets were tuned by adding polyethylene glycol as a capping agent, which in turn affects the band gap and subsequently, their photocatalytic properties. The samples were characterized using x-ray diffraction, transmission electron microscopy and absorption spectrophotometry. Photocatalytic effect of the synthesized bismuth titanate nanosheets on methylene blue dye also studied and variation of band gap depending on thickness of the nanosheets were observed.
Introduction
Bismuth titanates are a large class of compounds of metal oxides of bismuth and titanium. Most of these materials characterize a perovskite-like crystal structure with alternating layers of Bi2O2+ and Mn−1TinO3n+1m+ where M is a metal atom (Newnham, Wolfe & Dorrian, 1971). These materials display a wide variety of physical properties, both in bulk as well as in the nano regime, depending on the metal M (Chiang, Farrey & Soukhojak, 1998; Koroleva et al., 2013; Ramana et al., 2017). Bismuth titanate in the simplest form has Ti replacing M, resulting in Bi4Ti3O12 which characterize a perovskite structure which was first reported in 1949 by Aurivillius (1949). Other two phases of this compound are pyrochlore (Yx−1BixTi2O7, Y = Ti) and sillenite (Bi12TiO24) (Skorikov et al., 2005; Noureldine et al., 2015; Lanfredi & Nobre, 2005). These are well known for characteristics like ferro, piezo and pyroelectric effects used in various applications including photovoltaics and photocatalysis (Lazarević, Stojanović & Varela, 2005).
Photocatalysis is a well-studied method to break down long-chain effluents, pollutants and even microbes in wastewater (Sunada et al., 1998). Photocatalysis infrastructure plays a major role in treating and recycling wastewater from various chemical and bio-hazard facilities utilizing abundantly available solar energy. Seminal studies and implementation of photocatalysis pertaining to the Honda-Fujishima effect were reported using titanium dioxide owing to its high photocatalytic activity under the ultraviolet spectrum of solar irradiation (Hashimoto, Irie & Fujishima, 2005). Various other semiconductor nanocomposites have been since proposed to make better use of the solar spectra which mostly include ceramic oxides of metals like zinc, tungsten, etc. (Khan, Adil & Al-Mayouf, 2015; Maji et al., 2012; Park, Park & Kim, 2006; Zhao & Miyauchi, 2008).
Study of photocatalysis using bismuth titanate composites gained traction with research since the early 2000s owing to its capability of degrading dyes and eliminating microbes under visible light irradiation. This material is one of the major contributors towards bringing down the spectral sensitivity of photocatalysts below the ultraviolet region of the solar spectrum, making better use of the visible spectrum (Yao et al., 2003; Natarajan et al., 2013; Wei, Dai & Huang, 2009; Zambrano et al., 2017). Various bismuth titanate composites were also band engineered by tuning its crystalline phases, particle size and morphologies as well as by doping various elements to achieve precise characteristics appropriate for applications like photocatalysis, ferroelectrics and photovoltaics (Chen et al., 2016; Murugesan et al., 2010; Kong et al., 2008; Zhou et al., 2007).
The most studied synthesis methods reported for bismuth titanate with engineered band gap include solvothermal, sol-gel and solid-state routes. It has also been reported that bismuth titanate in the perovskite phase shows improved photocatalytic effects when they are textured along the (001) plane (Zhao et al., 2013; Dawley et al., 2001). This texture reveals as a sheet-like formation due to the perovskite crystalline nature of the Aurivillius bismuth titanate phase (Sardar & Walton, 2012; Chen, Li & Zhang, 2011). This work discusses the use of a quick microwave-initiated combustion synthesis of perovskite Bi4Ti3O12 nanosheets textured along the (001) plane and its photocatalytic efficiency in degrading methylene blue dye.
Materials and Methods
The bismuth titanate (BTO) nanosheets were synthesized by reacting stoichiometric amounts of bismuth and titanium precursors by microwave irradiation (Pirgholi-Givi, Farjami-Shayesteh & Azizian-Kalandaragh, 2019; Yang et al., 2013). The following reagents were used for the precursors as procured Bismuth nitrate pentahydrate ((Bi(NO3)3)5H2O, 99%; MERC, Mumbai, Maharashtra), glacial acetic acid (CH3COOH, 99%; Spectrachem, Lodi, NJ, USA), titanium tetraisopropoxide ((Ti{OCH(CH3)2)}4, 98%; Acros Organics, Geel, Belgium), acetylacetone (C5H8O2, 99%; Loba Chemie, Mumbai, Maharashtra) and polyethylene glycol (PEG-6000, 99%; Thermo Fischer Scientific, Waltham, MA, USA) were used in the synthesis.
The bismuth and titanium precursors used to synthesize bismuth titanate were prepared as follows. 5 g bismuth salt was dissolved in 4 mL glacial acetic acid and 1 mL pure water in room temperature under constant stirring. 0.79 mL titanium isopropoxide was dissolved dropwise in 0.55 mL acetylacetone under constant stirring in a cold bath to keep check of precipitation during the exothermic dissolution process. An extra 10% weight of Bi salt is added to the solution to compensate evaporation of bismuth during the synthesis (Thiruramanathan et al., 2016). The solutions were mixed in the appropriate volume ratios to create three sets of samples, to which 0.02, 0.04 and 0.06 g of polyethylene glycol were added.
These samples were then irradiated in an 800 W commercial microwave for 30 s in open glass beakers. The irradiation caused the precursor fluid to expand and then dry up, resulting in light yellow foams during the first 10 s of microwave irradiation. The reaction then proceeded to a combustion stage where the foams scintillate quickly over the whole volume producing brown nitrate fumes. The reaction ended completely after 30 s of irradiation resulting in soft, flaky, pale yellow nanocomposite ash. The samples were thoroughly washed multiple times in water, ethanol and acetone to remove residual material. These were then heated to 500 °C for 30 min to remove any organic residues and to obtain a stable crystalline structure (Du et al., 2008; Pirgholi-Givi, Farjami-Shayesteh & Azizian-Kalandaragh, 2019). The samples were then ground to fine powder using a pestle and mortar and stored.
The prepared samples were marked as A, B and C depending on the amount of PEG added to the precursor before the synthesis, 0.02, 0.04 and 0.06 g respectively. These samples were characterized for crystalline phases using X-ray diffraction (XRD) with the Bruker AXS D8 Advance over the range 10° to 80° with a resolution of 0.08°. The TEM images of the samples were captured using a Jeol JEM 2100 to a scale of 5 nm. The UV-Vis absorption spectra of the samples were recorded using a Jasco 570 spectrophotometer within the wavelength range of 850 to 190 nm. CHNS analysis to determine the amount of residual carbon and other residual elements using the Elementar Vario EL III. The data from experiments were analyzed using the IPython and NumPy packages (Hunter, 2007; Perez & Granger, 2007) and plots were generated using the Matplotlib package (Harris et al., 2020).
A control sample of bismuth titanate was synthesized by the sol-gel method for comparison of photocatalysis and is labelled as K (Yao et al., 2003). Known amounts of these dispersions were mixed with measured quantities of methylene blue (MB) dye solution and irradiated with a 1,000 W Xenon lamp for measuring the photodegradation effects.
Results
The fine powdered samples were characterized for crystalline nature using XRD and the patterns were search-matched using the Full Profile Search Match (FPSM) tool (Lutterotti et al., 2019; Lutterotti, 2012). Refining was done using the Maud package (Lutterotti et al., 2007). The XRD pattern of the samples A, B and C are depicted in Fig. 1. Search-match on the recorded patterns confirm the presence of bismuth titanate in perovskite phase having strongest lines of JCPDS 35-0795 seen in various reports including the seminal report (Pirgholi-Givi, Farjami-Shayesteh & Azizian-Kalandaragh, 2019; Nogueira et al., 2014; Chen, Li & Zhang, 2011; Yi et al., 2009). Traces of bismuth oxides (JCPDS 77-0374) were also detected and estimated to be less than 7%. This can be attributed to the extra bismuth precursor added for compensating evaporation losses (Zarycka et al., 2005).

Figure 1: X-ray diffraction pattern of BTO samples (A), (B) and (C) prepared by varying PEG-6000 added during synthesis with matching lines for Bi4Ti3O12 JCPDS 35-0795 and minute traces of Bi2O3 JCPDS 77-0374.
The bottom subplots show the prominent peaks of JCPDS files 35-0795 (BTO) and 77-0374 (BiO), where the thickness of the line corresponds to the prominence of the peak. The Bi2O3 peaks are marked with an asterisk (*) instead of indices.
The estimated crystallite sizes for the particles using the Debye-Scherrer equation on the most prominent peak (117) are 18, 41 and 51 nm for samples A, B and C respectively (Cullity & Stock, 2014; Langford & Wilson, 1978). This plane corresponds to the lateral dimension of the sheets and the crystallite sizes correlate roughly to the dimensions along the a-b axes.
The SAED patterns of the samples depicted in Fig. 2 confirms in conjunction with the XRD patterns, that the variation in crystallinity between the samples as well as the d-spacing corresponding to the prominent peaks in the XRD pattern. It can also be noted that the crystalline nature of the individual sheets tends to form single crystallites for samples B and C, with little broadening of diffracted X-rays. It can be noted that Fig. 2C shows the presence of 2.7 Å planes together with the 2.9 Å showing that the (00L) plane gaining prominence with the strongest (117) peak. The prominent diffraction spots match with the prominent peaks in XRD. Samples tend to show single crystallite like features with the increase in amount of PEG.

Figure 2: SAED pattern of BTO samples (A), (B) and (C) show the variation in crystallinity increasing with the addition of PEG-6000 during the synthesis.
2C shows the <117> plane of 2.7 Å spacing gaining prominenece with single crystallite-like features. The crystal planes measured on the SAED planes match those of bismuth titanate; a = 2.3 Å, b = 2.9 Å and c = 3.2 Å.
The TEM images depicted in Fig. 3 reveal the rectangular sheet morphology of the bismuth titanate nanostructures with nanometer thickness. The lateral dimensions are found to be up to around 100 to 200 nm while the thickness of the sample increases with the increase in the amount of PEG-6000 added to the precursor before synthesis, matching the XRD patterns recorded. This corresponding increase can be attributed to the effects of the capping agent controlling the lateral growth over the (001) axis of the bismuth titanate crystallite (Bakshi, 2015; Kubiak et al., 2020). The thickness of the nanosheets could not be determined using TEM due to practical limitations.

Figure 3: TEM recordings of BTO samples (A), (B) and (C) shows their sheet-like morphology.
The thickness of the sheet increases depending on the PEG-6000 added before synthesis (A) having 0.02 g, (B) having 0.04 g and (C) having 0.06 g of PEG-6000 respectively. Sample A shows a mixture of sheets and agglomerated spheroids. The thickness of the sheets increase with the amount of PEG, showing the effect of the surfactant on the synthesis.
CHNS analysis of the samples show the presence of at most 0.84% C, 0.08% N and 0.02% H. This confirms that the capping agent was virtually absent in the sample and was completely incinerated and washed away. It can thus be stated that the PEG acts as a template agent providing nucleation and capping assisting the growth of the BTO nanosheets. All other residual material including nitrates and organic compounds can be considered absent.
The UV-visible absorbance spectra of A, B and C are depicted in Fig. 4. All samples have a familiar wide absorbance over the visible region as well as a peak at around 260 and 220 nm, which are well-known characteristics of bismuth titanate. The gradual rise of the absorbance curve denotes that the samples have a direct band gap. This has been identified and estimated by plotting hν against (αhν)2 where the values fit linearly to the equation showing allowed direct band gap transitions as depicted in Fig. 5, (Davis & Mott, 1970; Tauc, 1968). The Tauc plots of the absorbance spectra were used to estimate the band gap of A, B and C which lie around 2.77 eV, 2.97 eV and 3.12 eV respectively, which are on the higher side of the reported band gap of bismuth titanate nanocomposites (Yao et al., 2004; Lin et al., 2012; He et al., 2014). It was also evident that the band gap of the samples can be tuned by varying the amount of PEG-6000 added to the precursors during synthesis. The change in band gap can be attributed to oxygen deficiencies that originate at the faces of the nanosheets due to imperfections in atomic arrangements. It is assumable that more perfect the crystallite arrangement, the lesser defects are present. This is because the oxygen deficient sites that form at the crystallite faces of the nanosheets due to imperfections in the structure, produce a band of new electronic states, in effect, lowering the band gap of the material. This effect has been seen in action previously in titania and certain bismuth titanates (Bark, 2013; Han & Bark, 2014; Choi et al., 2012; Badmus et al., 2021; Yao et al., 2020). This in turn brings the band gap of the material closer to the values of pristine bismuth titanate (Murugesan et al., 2010).

Figure 4: Absorbance spectra of synthesized BTO samples (A), (B) and (C) shows that the samples have increasing absorbance peaks depending on the amount of PEG-6000 added during syntheses.

Figure 5: Tauc plots of BTO samples (A), (B) and (C) and the corresponding estimated band gap values, 2.77, 2.97 and 3.12 eV respectively.
Given that the known band gap of bulk bismuth titanate in the perovskite form is around 3.1 eV, reduction of thickness of the nanosheets reduces the band gap of the material.
Photocatalysis
The photocatalytic effects of the nanocomposites on the photodegradation of methylene blue dye were studied by irradiating a 1,000 W Xenon lamp on 0.1 μmol of methylene blue dye dissolved in 50 mL of pure water. The dye solution was segregated into five transparent glass containers of 10 mL each. Four of these solutions were added with 5 mg of the samples A, B, C and K. IR irradiation from the lamp was mitigated using a 20 mm block of water that was placed between the sample and the lamp. Photodegradation characteristics of the dye samples with and without the photocatalyst were studied over a period of 100 min by measuring the characteristic absorbance peak of methylene blue dye. The enhancement of photodegradation caused by dispersing 5 mg each of the synthesized bismuth titanate samples A, B, C and K were recorded and compared to a “blank” MB dye sample D that does not have the photocatalyst. Variation in absorbance of the dye samples were sampled over a span of 180 min. The variation of the characteristic absorbance against time for the dye samples are depicted in Fig. 6.

Figure 6: Photodegradation of methylene blue dye measured over its characteristic peak compared with addition of samples (A), (B) and (C) show a final degradation concentration of up to 20.2%, 13.1% and 7.2% respectively, while the dye alone showed a final degradation of 22.1%.
Sample A shows lesser photocatalytic efficiency corresponding to its lower absorbance levels.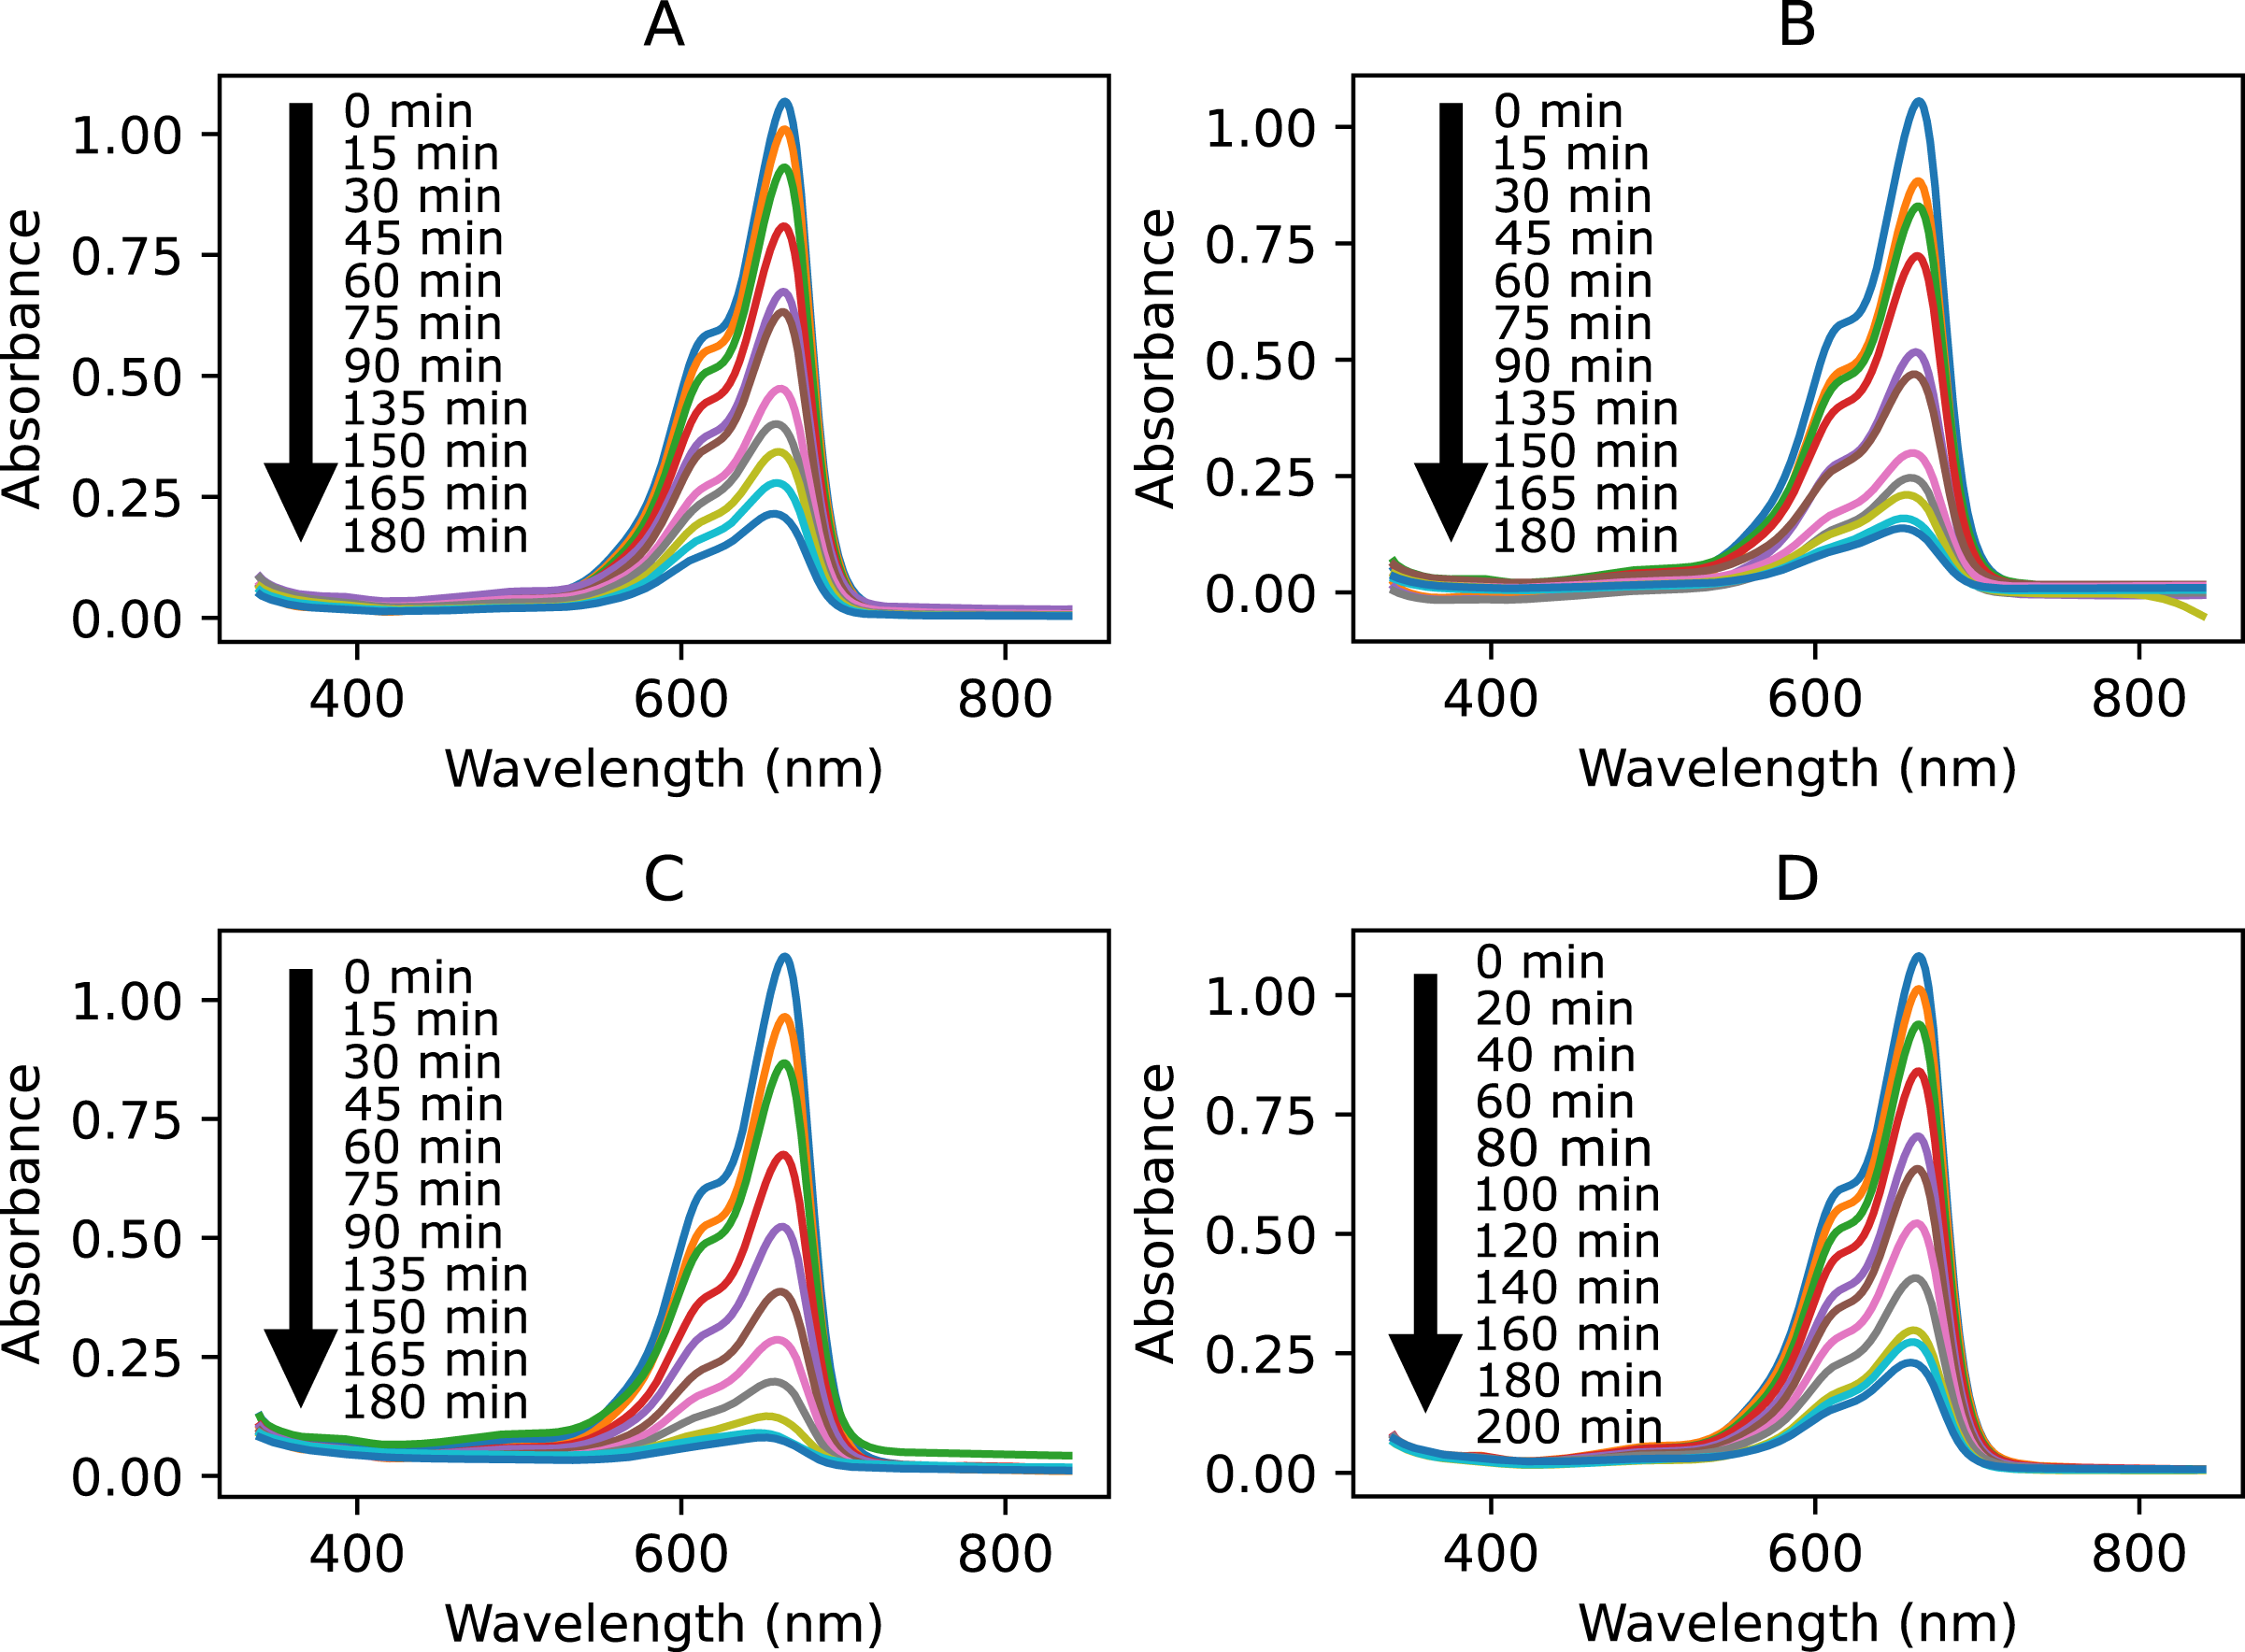
To calculate the photodegradation characteristics, the variation over time of peak absorbance of methylene blue dye at 653 nm against irradiation time of the samples is plotted. Degradation of the dye improved with the photocatalyst added and the final dye concentration at the 180-min mark reduced to 20.2%, 13.1% and 7.2%, for dye samples added with photocatalysts A, B, C respectively. Sample D, which did not have any photocatalyst degraded only up to 77.9%. The control sample K showed degradation close to sample B and C. The logarithmic degradation of the samples was compared, and sample C shows better photocatalysis throughout the 180-min irradiation as shown in Fig. 7.

Figure 7: Reaction characteristics of the photodegradation of MB dye catalyzed by BTO samples (A), (B) and (C) depict logarithmic photodegradation.
The control sample K has photodegradation characteristics similar to (B) and (C). The markers show experimental data, while the solid lines show straight line fits.
Discussion
The organic complex formed by the reagents tend to be stabler than both bismuth nitrate pentahydrate and titanium isopropoxide, because of the organic ligands that associate to the metal ions preventing them from reacting to water. The combustion reaction initiated by microwave irradiation tend to form nanosheets of varying thickness and lateral dimensions depending on the amount of PEG added to the precursor. The formation of such sheet structures as well as the mechanism of thickness variation depending on the amount of PEG added would be because the PEG provides a template for the formation nanoparticles. It is well known that PEG tends to aggregate the formed nanoparticles into sheets that extend over tens of nanometers in size (Zomorodian et al., 2018; Yoleva et al., 2011). As the amount of PEG in the precursor increases, greater number of nucleation occur within the PEG sheets in all directions. As the nuclei grow into nanoparticles, they conform into sheets with thicknesses depending on the nucleation along the z axis. Sample A shows both sheets as well as deformed agglomerates because the amount of PEG required in the precursor for sheet-like nucleation as well as size control is low, resulting in spheroid formations.
An effort towards rationalizing the thickness of the formed nanosheets has been done by estimating the crystallite size along the (001) direction using XRD. This is typically done by applying the Debye-Scherrer equation on the (001) plane. Since the (001) peak was barely measurable, the FHWM as well as height of the XRD peak of the more prominent (002) plane was used for this estimation. The crystallite sizes estimated corresponds to the half-point of the crystal plane (Kim et al., 2001; Holder & Schaak, 2019). The samples A, B, and C are overestimated to have approximate crystallite sizes less than 7.0, 8.1 and 9.1 nm respectively (Monshi, 2012). Given that various minor peaks add towards the total FWHM, the estimated sizes should be considered higher especially for sample A.
The photodegradation experiment was conducted for an indicative comparison of the variation of efficacies between the synthesized samples. The reaction kinetics of the photodegradation follows a first order nature which has been verified by fitting the variation of absorbance of the characteristic peak of the dye to the equation , where C0 is the absorbance value at the beginning of the experiment and C is the variation in absorbance value over time t of reaction (Xiao et al., 2013; Aarthi & Madras, 2007). Since the physical parameters are only slightly varied between the samples, the photodegradation effect can be attributed mainly to the enhancement in the absorbance which is evident in the absorbance spectra of the samples in Fig. 4. Sample A has the lowest photodegradation coefficient of the lot owing to its lower absorbance characteristics.
Conclusions
Perovskite bismuth titanate nanosheets were synthesized from bismuth and titanium precursors in a microwave-initiated combustion method. The resulting nanocomposite had less than 7% estimated bismuth oxide phases. Nanosheet morphology was confirmed with an average lateral dimensions of range 100 to 200 nm. The thickness of the nanosheets were varied by the addition of polyethylene glycol during synthesis, which in turn affects the band gap of the material. The photodegradation reaction of methylene blue dye with the BTO samples followed a logarithmic degradation. The sample synthesized by adding 0.06 g of PEG has optimum characteristics to improve photocatalytic effects than samples with 0.02 and 0.04 g of PEG.